Map
Purpose
The Map ViewTemplate renders geospatial data on an interactive map. It supports markers, radius overlays, polylines, polygons, and GeoJSON-based additional features.
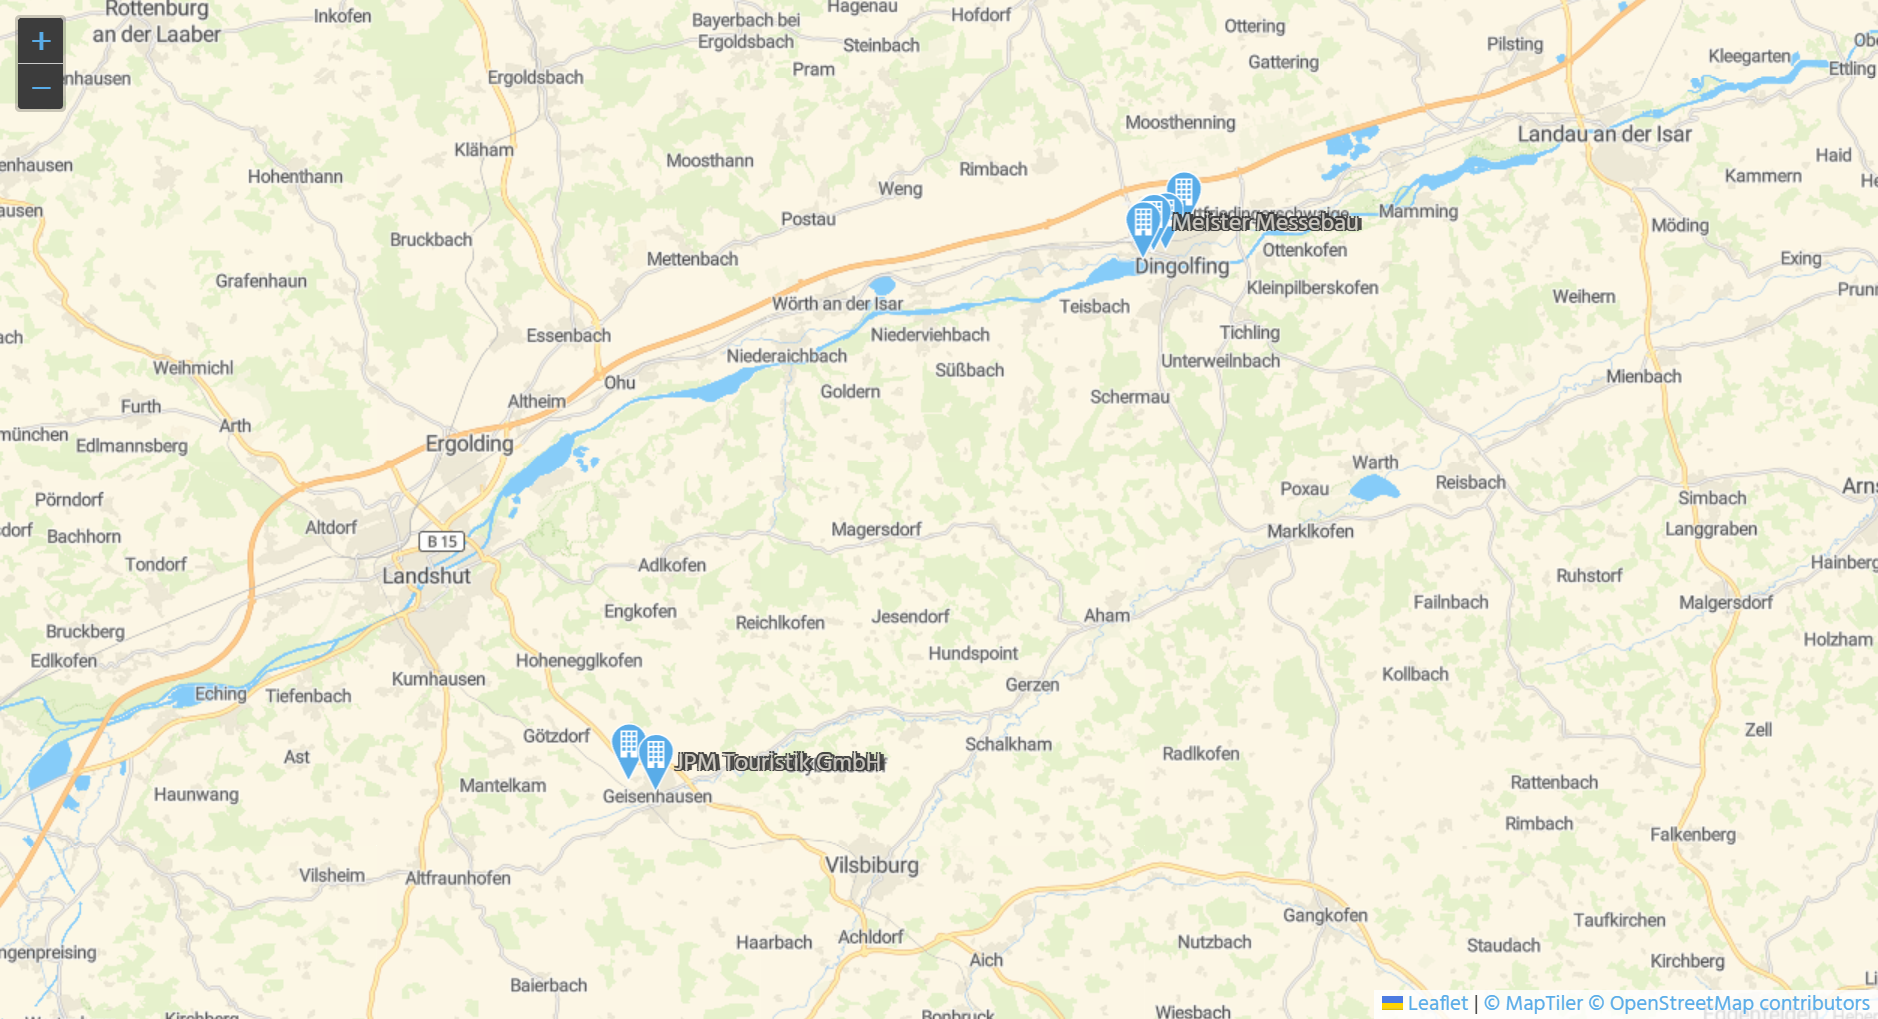 Figure: Map ViewTemplate showing company locations.
Behavior
The ViewTemplate uses a tile-based map server and combines map tiles with data-driven overlays. It is commonly used to visualize addresses, service areas, and search ranges.
Supported map elements include:
- markers based on longitude and latitude
- radius overlays around a central position
- polylines and polygons
- GeoJSON feature collections for custom elements
Configuration
Prerequisites
For marker-based map views, the underlying records must provide valid geolocation data. In the standard company example, STANDARD_LON and STANDARD_LAT in Organisation_entity reference the address coordinates in Address_entity from module contact.
If addresses are created in the client, coordinates can be generated automatically through:
new LocationFinder().getGeoLocation(address)
This requires a configured Nominatim setup.
If imported addresses are missing coordinates, the server processes setMissingAddressLocations_serverProcess or updateAllAddressLocations_serverProcess can be used.
Main ViewTemplate properties
| Property | Description |
|---|---|
configField | Provides the map configuration as JSON. |
autoGeneratedMarkerLatitudeField | Defines the latitude field for generated markers. |
autoGeneratedMarkerLongitudeField | Defines the longitude field for generated markers. |
autoGeneratedMarkerColorField | Defines the marker color. |
geoJsonFeatureCollectionField | Provides additional map features as GeoJSON. |
maxDBRow | Limits the number of displayed records. |
The configField is typically filled by a valueProcess, for example using helper functions from MapViewTemplate_lib.
Map server requirements
The tile server must be Leaflet-compatible and provide raster tiles in EPSG3857 with an xyz URL scheme using placeholders such as {z}, {x}, and {y}.
Example configuration:
{
"startingCenterPosition": {
"lat": 50.989791,
"lon": 4.772377,
"autoLocate": true,
"zoomLevel": 5
},
"boundaries": {
"minZoom": 1,
"maxZoom": 20
},
"tiles": [
{
"title": "Streetmap",
"url": "https://api.maptiler.com/maps/streets/256/{z}/{x}/{y}.png?key=rf1XkCIjY4iUR4sACNjT",
"attribution": "<a href='https://www.maptiler.com/copyright/' target='_blank'>© MapTiler</a> <a href='https://www.openstreetmap.org/copyright' target='_blank'>© OpenStreetMap contributors</a>"
}
]
}
Example GeoJSON overlay
The following example shows a GeoJSON-based radius marker with drill-down metadata:
var homeFeatureCollection = {
  "type": "FeatureCollection",
  "features": [
    {
      "type": "Feature",
      "properties": {
        "ADITO-radius": vars.get("$field.SearchRadius") * 1000,
        "ADITO-color": neon.PRIORITY_HIGH_COLOR,
        "ADITO-icon": "VAADIN:MAP_MARKER",
        "ADITO-targetContext": "Organisation",
        "ADITO-targetId": vars.get("$param.OriginUid_param"),
        "ADITO-label": ContextUtils.loadContentTitle("Organisation_entity", vars.get("$param.OriginUid_param"))
      },
      "geometry": {
        "type": "Point",
        "coordinates": [
          parseFloat(vars.get("$param.LocationLon_param"), 10),
          parseFloat(vars.get("$param.LocationLat_param"), 10)
        ]
      }
    }
  ]
};
Example usage
An example is the ViewTemplate OrganisationMap in OrganisationFilter_view.
In the ADITO client, it can be used under Contact Management > Company. Users typically filter companies in the Table ViewTemplate first and then switch to Map to visualize the filtered result.
Implementation hints
This ViewTemplate requires a configured geolocation setup if marker coordinates should be generated automatically from addresses.
The tile server must be Leaflet-compatible and provide raster tiles in EPSG3857 with an xyz URL scheme.
Because tile requests are made through standard image URLs, OAuth-protected tile access is not supported. API keys contained in tile URLs can be inspected in browser developer tools.
Notes
MapTiler can be used as a tile provider by configuring geo.maptiler.apikey and restarting the server.