DynamicMultiDataChart
Purpose
The DynamicMultiDataChart ViewTemplate visualizes multi-dimensional data with a reduced configuration effort. It is intended for scenarios in which end users should be able to group and aggregate chart data interactively in the client.
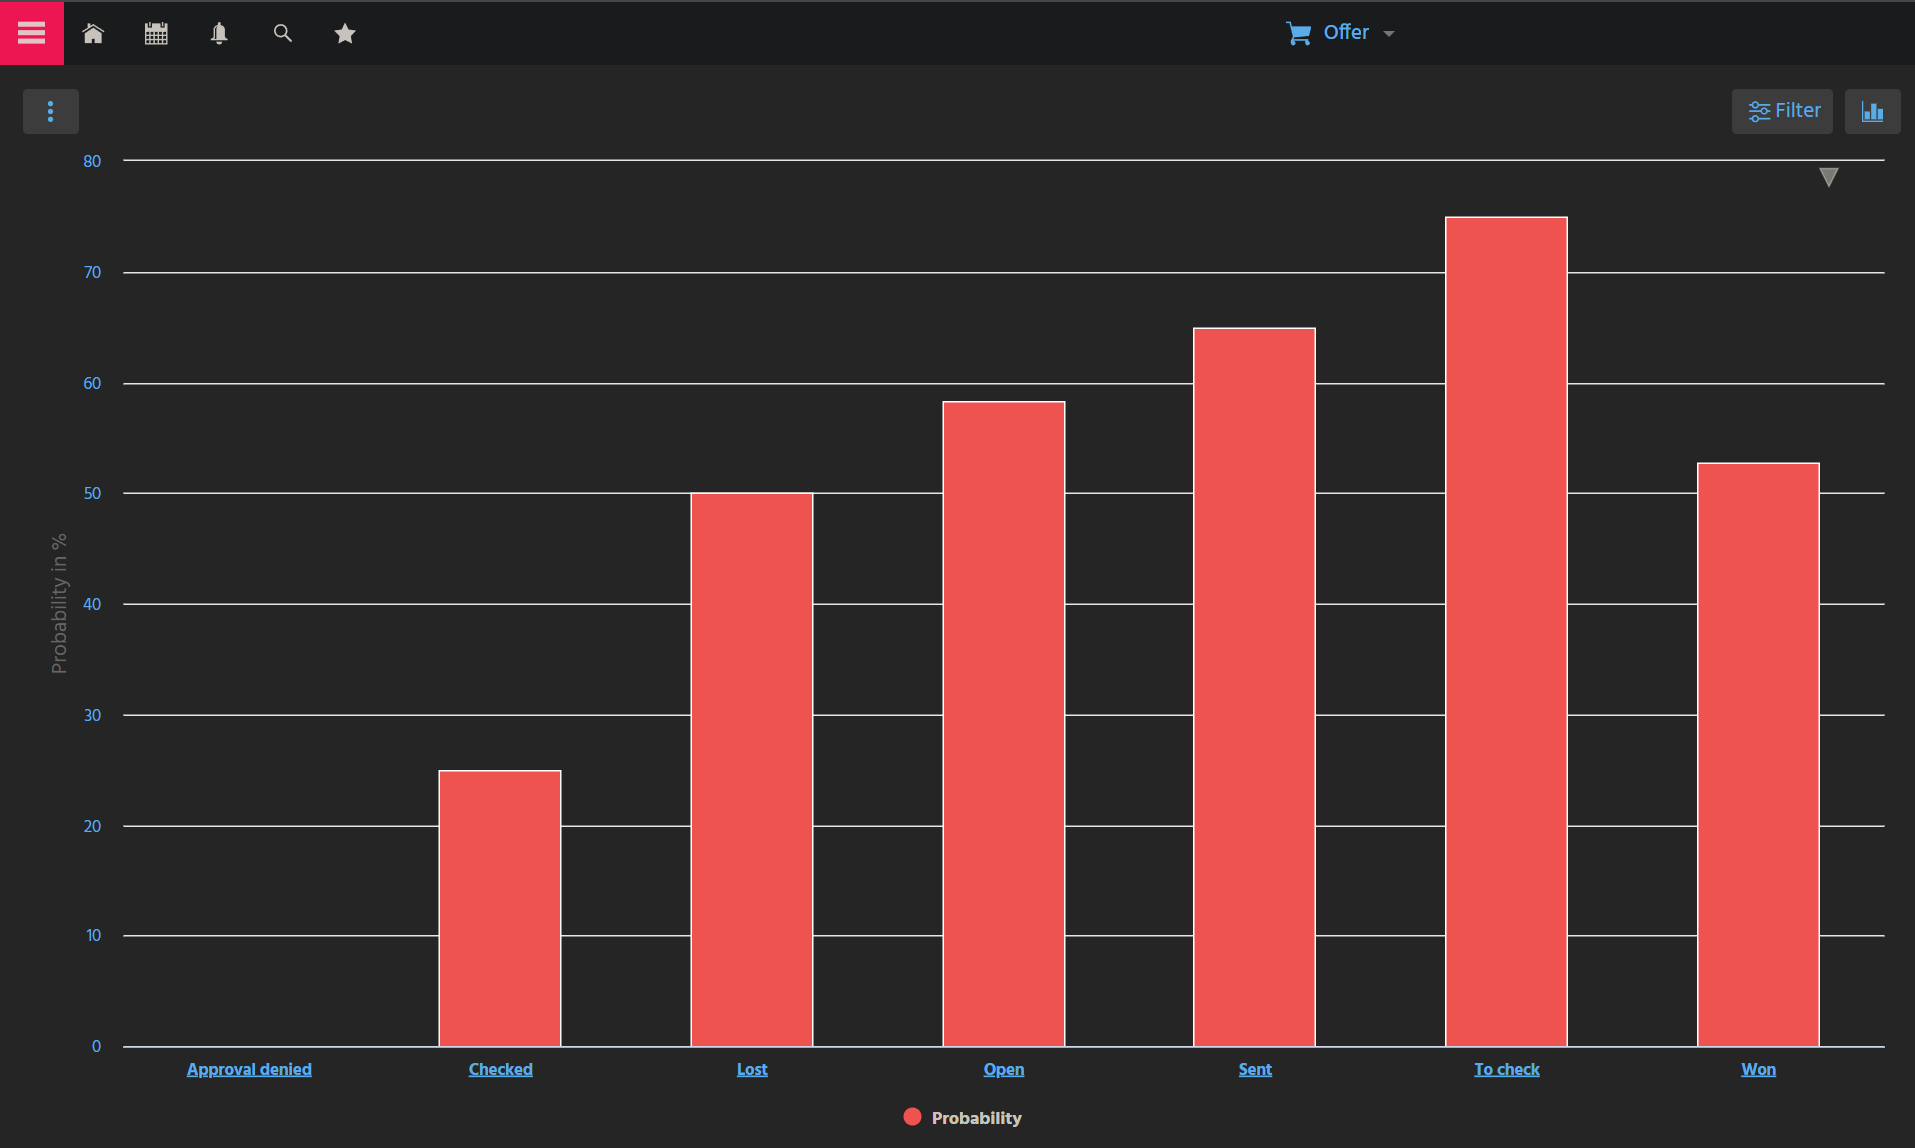 Figure: DynamicMultiDataChart showing grouped values.
Behavior
Compared to MultiDataChart, this ViewTemplate requires only the base dataset and the field to be aggregated. Grouping logic and chart selection are performed by the user at runtime.
This makes the ViewTemplate suitable for dashboards and analytical Views in which flexible exploration is more important than a fully predefined chart definition.
Configuration
The ViewTemplate requires the following properties:
| Property | Description |
|---|---|
entityField | Defines the dataset source used for chart generation. |
aggregateField | Defines the field that should be aggregated. |
Users can then choose grouping dimensions, aggregation behavior, and available chart variants in the client.
Example usage
An example is the ViewTemplate DynamicMultiDataChartProb in OfferFilter_view.
In the ADITO client, it can be accessed under Sales > Offer > Probability Chart. In this example, the chart shows grouped values such as offer statuses and their aggregated metrics.
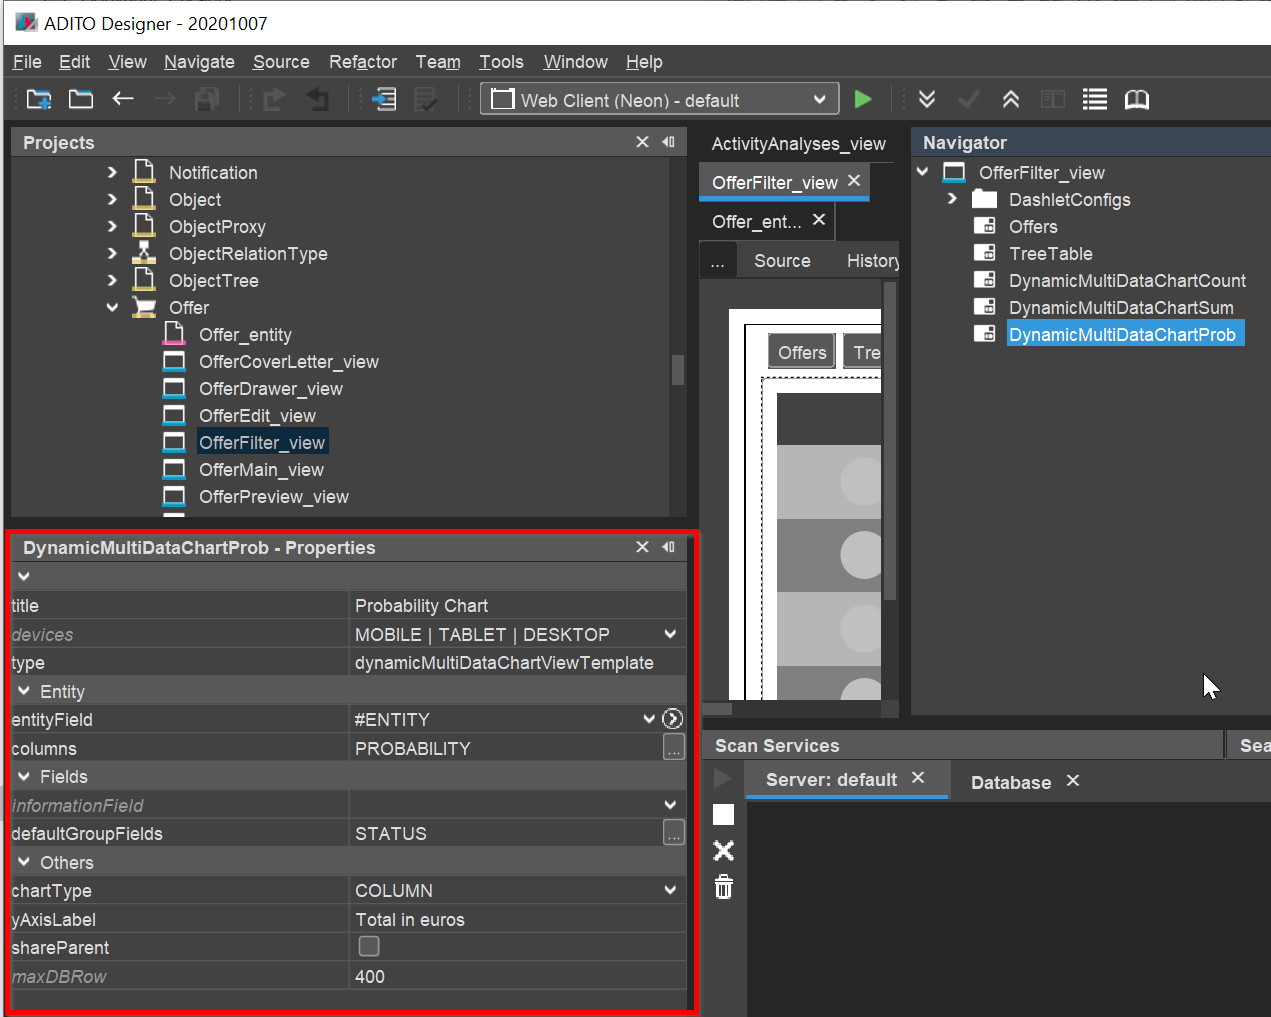 Figure: Example configuration of the DynamicMultiDataChart.
Notes
Use DynamicMultiDataChart when the grouping structure should remain flexible for end users. If the chart logic should be defined completely in the implementation, use MultiDataChart instead.