DynamicSingleDataChart
Purpose
The DynamicSingleDataChart ViewTemplate visualizes single-dimensional chart data with a minimal configuration. It is intended for chart scenarios in which end users should be able to switch chart variants and adjust the grouping interactively.
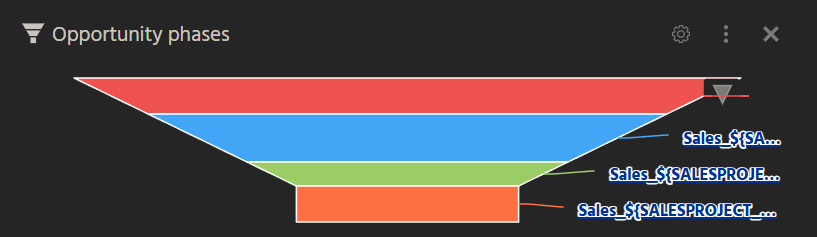 Figure: DynamicSingleDataChart in the Sales Dashboard.
Behavior
The implementation only needs to define the base dataset and the aggregated value. Grouping and chart presentation are then controlled in the client.
Typical chart variants include funnel, pie, and pyramid charts.
Configuration
The following properties are required:
| Property | Description |
|---|---|
entityField | Defines the dataset source. |
aggregateField | Defines the field whose values are aggregated. |
Example usage
Typical example ViewTemplates are PhaseFunnelChart, PhasePieChart, and PhasePyramidChart in SalesprojectAnalysesPhases_view.
In the ADITO client, this ViewTemplate is used, for example, in the Sales Dashboard under Sales > Sales Dashboard, where users can switch between supported chart types for the same underlying data.
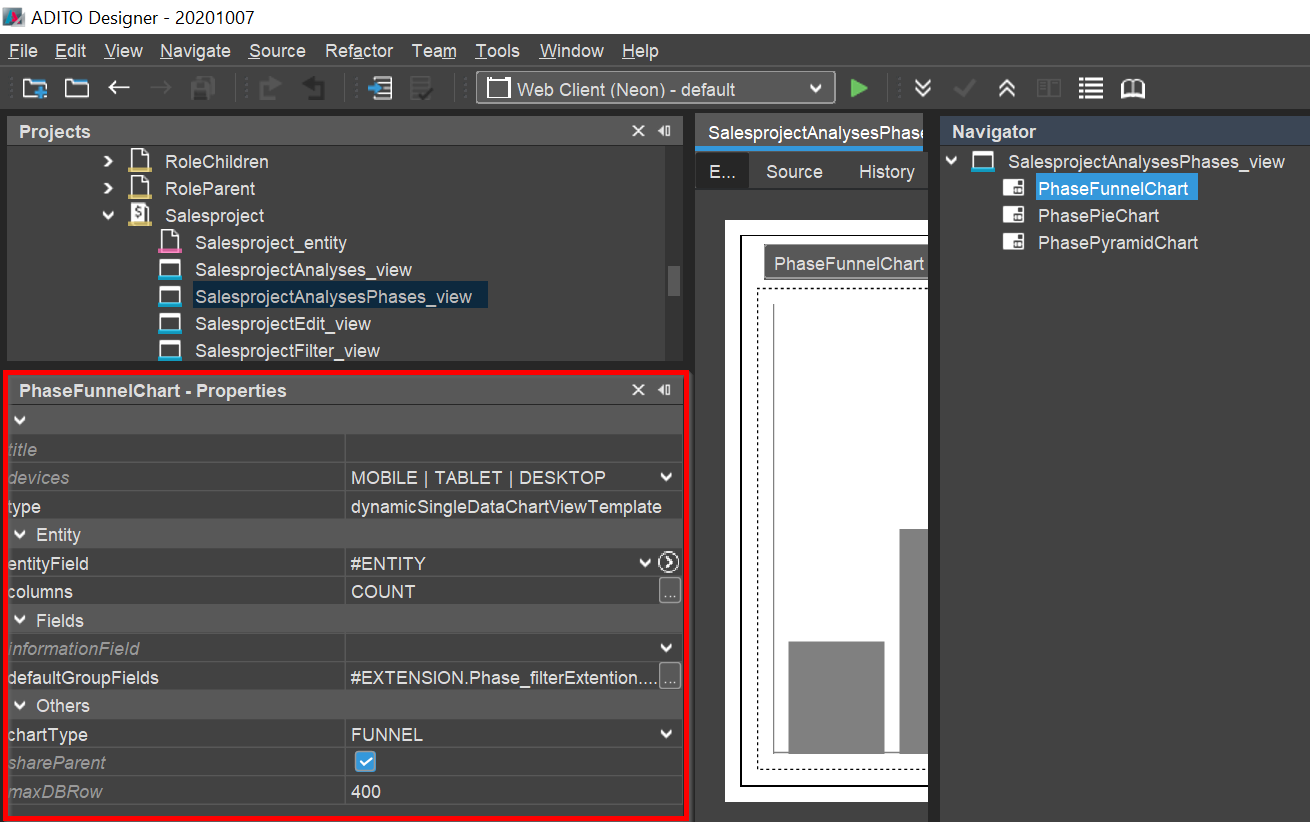 Figure: Example configuration of the DynamicSingleDataChart.
Notes
Use DynamicSingleDataChart if business users should be able to work with one-dimensional chart data without requiring a fixed chart definition in the backend.