SingleDataChart
Purpose
The SingleDataChart ViewTemplate visualizes one-dimensional data as a chart. It is used for scenarios in which each X-axis entry corresponds to exactly one Y-axis value, for example in pie, donut, funnel, or pyramid charts.
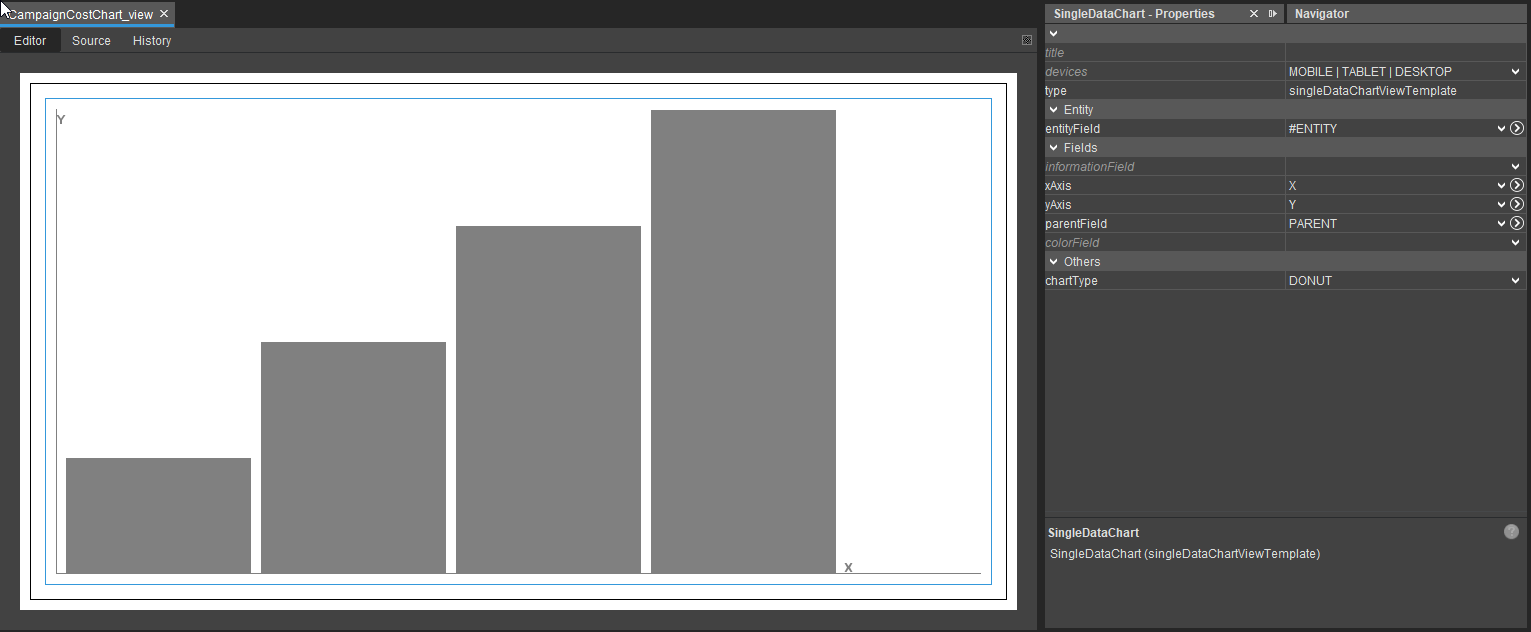 Figure: SingleDataChart displaying one-dimensional chart data.
Behavior
The ViewTemplate typically reads its data through a JDitoRecordContainer. Drill-downs can be implemented through parentField, which allows child chart entries to be linked to parent entries.
Supported chart types include:
DONUTFUNNELPIEPYRAMID
Configuration
Typical properties include:
| Property | Description |
|---|---|
entityField | Defines the source entity, often #ENTITY. |
informationField | Defines the chart labels. |
xAxis | Defines the categorical dimension. |
yAxis | Defines the value dimension. |
parentField | Defines drill-down relationships. |
chartType | Defines the chart type. |
colorField | Optionally defines the chart colors, typically through neon. constants. |
showDataLabelValues | Controls whether numeric labels are shown. |
dataLabelPositionInside | Controls whether labels are shown inside data points. |
Example colorField logic:
result.string(neon.USER_COLOR_1);
Example usage
An example is the ViewTemplate SingleDataChart in CampaignCostChart_view.
In the ADITO client, it is shown under Marketing > Campaign in the Overview area of CampaignMain_view, where it displays a donut chart for fixed and variable costs.
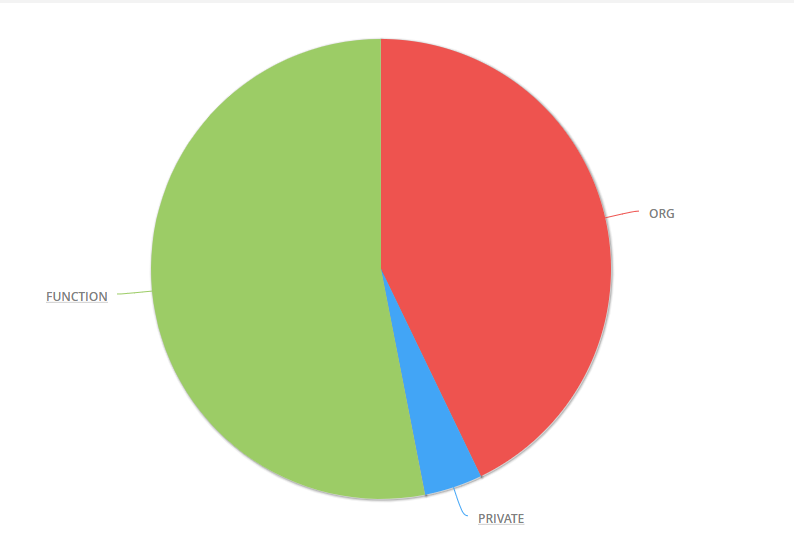 Figure: Example of a pie chart based on contact distribution.
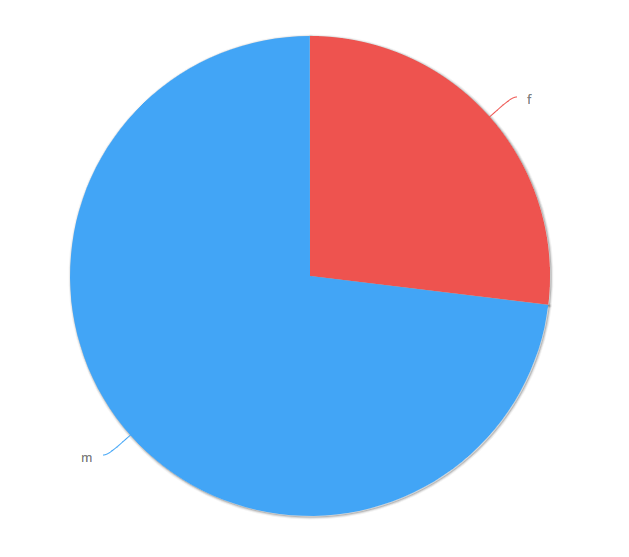 Figure: Example of a drill-down into a chart segment.
Implementation hints
A common implementation pattern is to create records in the contentProcess that contain values for UID, X, Y, INFORMATION, and optionally PARENTID. Parent entries must be added before their child entries so that drill-down relationships can be resolved correctly.