MultiDataChart
Purpose
The MultiDataChart ViewTemplate visualizes multi-dimensional data in chart form. It supports multiple Y values for one X value and is therefore suitable for grouped charts such as bar, column, area, spline, or line charts.
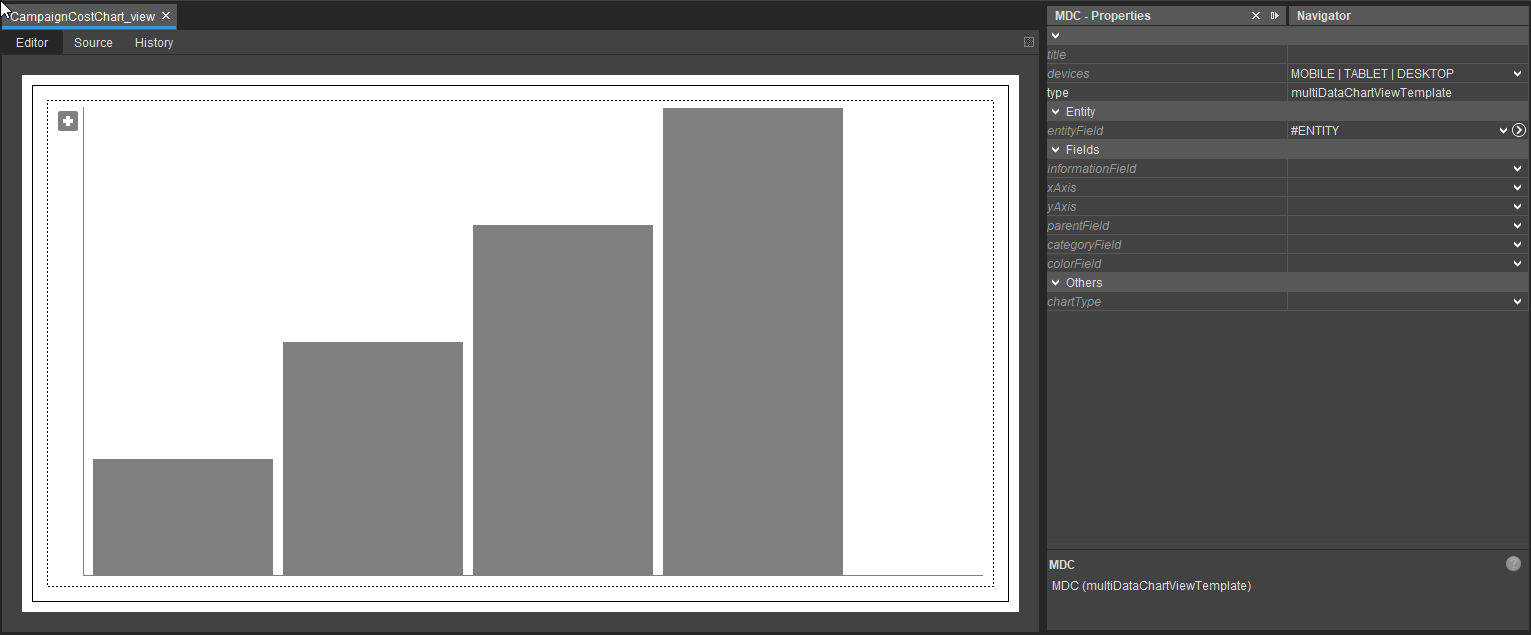 Figure: MultiDataChart embedded in a View.
Behavior
The ViewTemplate is structurally similar to SingleDataChart but adds categoryField, which allows multiple values to be grouped under the same X-axis entry.
It can also support drill-down scenarios through parentField.
Configuration
The following properties are available:
| Property | Description |
|---|---|
entityField | Defines the source entity, often #ENTITY. |
informationField | Defines the labels shown in the chart. |
xAxis | Defines the X-axis. |
yAxis | Defines the Y-axis. |
categoryField | Defines the category dimension for multiple Y values per X value. |
parentField | Defines hierarchical drill-down relationships. |
colorField | Defines the chart color, typically via neon. constants. |
chartType | Defines the chart type. |
showDataLabelValues | Controls whether numeric values are shown as labels. |
dataLabelPositionInside | Controls whether labels are shown inside the data points. |
Example colorField logic:
result.string(neon.USER_COLOR_1);
Example usage
An example is the MultiDataChart used in CampaignParticipantChart_view.
In the ADITO client, it appears under Marketing > Campaign > CampaignMain_view > Overview. In this example, it visualizes participant-related values grouped by category.
Implementation note
MultiDataChart typically retrieves its data from a JDitoRecordContainer. A common implementation pattern is to build rows containing UID, X, Y, CATEGORY, and INFORMATION values in the contentProcess.
Use MultiDataChart when the grouping structure is part of the implementation. If grouping should be controlled mainly in the client, use DynamicMultiDataChart instead.