Logging
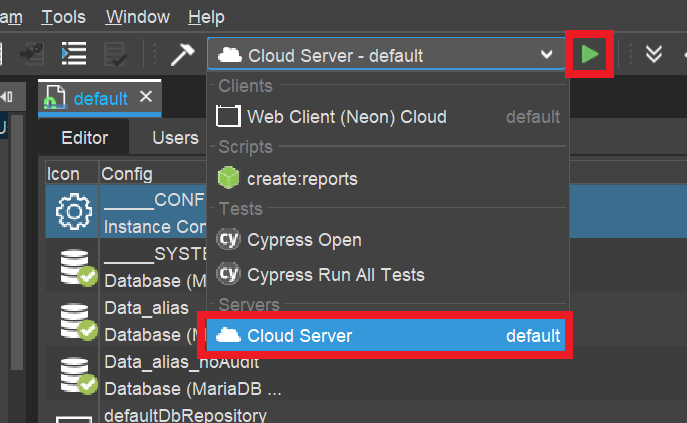
In addition to the debugger, see Designer Manual (PDF), the ADITO server log helps you analyze how the system is running and which errors occur, including their source. If the server is running, its log can be displayed via the run configuration named Cloud Server - <system name>, which can be selected from the combo box below the ADITO Designer menu bar.
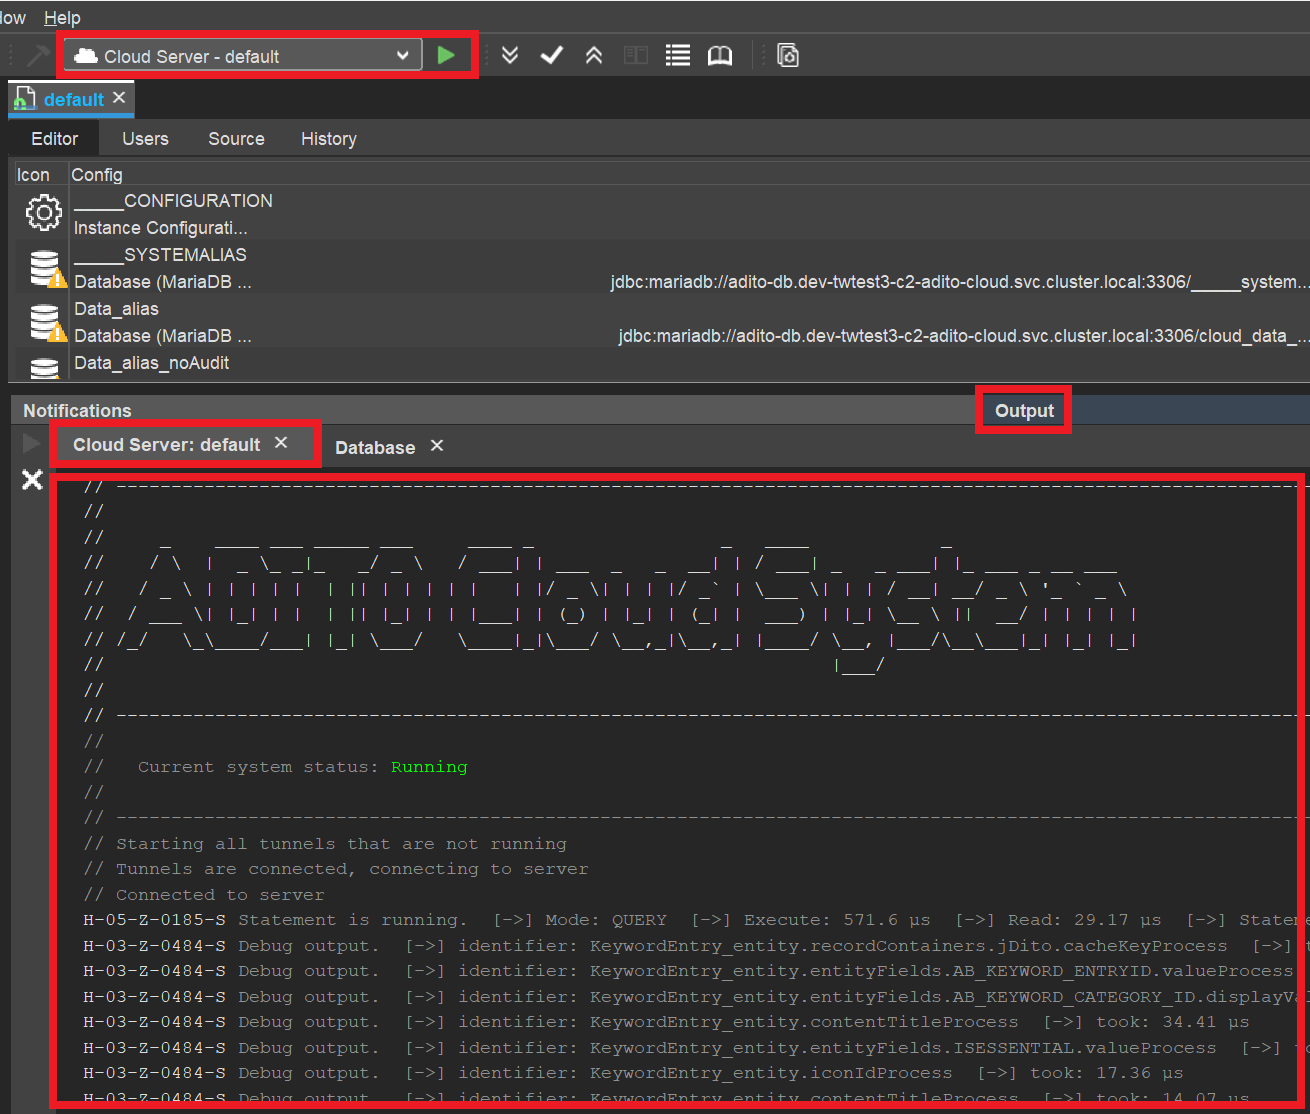
Once this run configuration has been started, a tab named Output appears in the lower middle part of the Designer. It contains a sub-tab named Cloud Server: <system name>, which shows the server log:
Predefined logging
By default, only errors and a few functions are logged. Therefore, it is recommended to activate logging for the following:
- database access (to see, e.g., what SQL statements are executed)
- JDito processes (to see, e.g., how often the valueProcess of an EntityField is executed, which can be a hint to performance problems - see AID066 Performance Optimization)
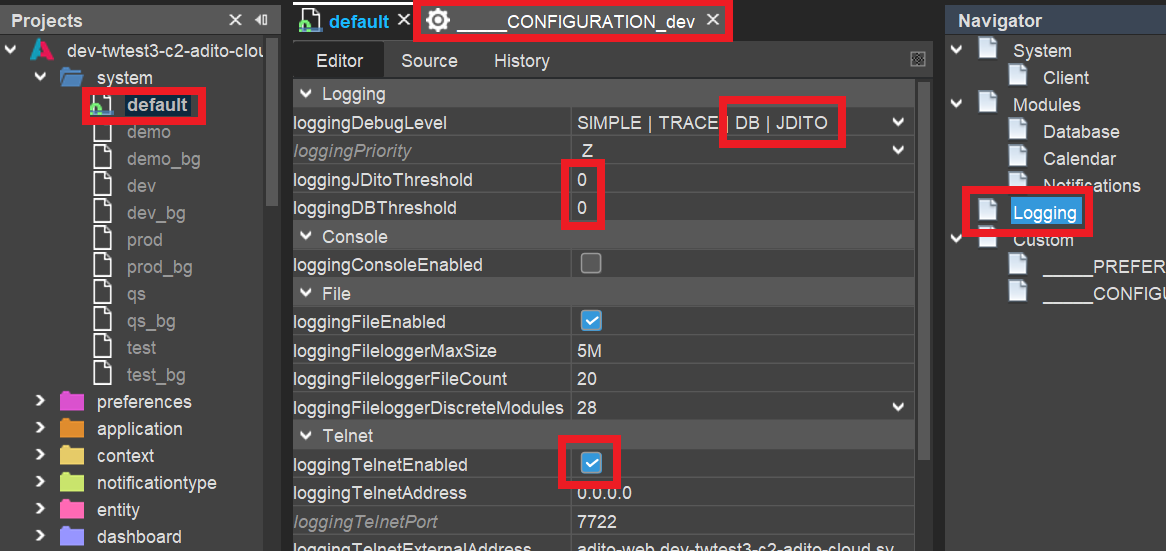
In the instance configuration, see the chapter Instance configuration in the Customizing Manual (PDF), click Logging in the Navigator window. This shows the logging properties in the Editor. Then:
- open the combo box of property
loggingDebugLeveland additionally selectDBandJDITO - set
loggingJDitoThresholdandloggingDBThresholdboth to0, which means that all JDito processes and all database access are logged, even if they are very short - ensure that
loggingTelnetEnabledis set totrue
You can verify the success by opening any View in the client (e.g., of Context "Company", in menu group "Contact Management") and watching if the server log (in Window "Output") shows log entries for every SELECT statement and for every JDito process being executed.
If you encounter problems, you may find a solution in chapter "Troubleshooting".
Customized logging
You can add additional entries to the server log by using methods of module logging. A simple example is:
import { logging } from "@aditosoftware/jdito-types";

logging.log("This is the text to be logged.");
The JSDoc of these methods shows which additional parameters can be passed, for example to specify a log level. In addition, further logging methods are available, such as logging.logCustom or logging.debug, which provide more control over the log message. More information is available via the autocompletion of logging. or via Help > Show Documentation, which requires the Help plugin.
If you want to log an object, the best overview is usually achieved by converting it to JSON first. While JSON.stringify(object) returns the content in a single line, a more readable result is produced by using JSON.stringify(object, null, " ").
{
 "entity": "Person_entity",
 "object": {
  "PERSON_ID": "0a611832-9476-481e-bde5-af3c3a98f1b4",
  "CONTACTID": "a8a5f214-8165-4627-bee2-bceb3578147e",
  "FIRSTNAME": "John",
  "LASTNAME": "Smith"
  }
}
Logging in "catch" section
In practice, logging is often used in the catch section of try...catch. A common mistake is to log only the error object itself:
try
{
    ()...)
}
catch(err)
{
    logging.log(err);
}
This often results in a long stack trace that is difficult to analyze.
Instead, the log should include further information that helps to identify the problem.
Example from contentProcess of Duplicate_entity (module duplicate):
    try
    {
        duplicates = duplicates.concat((new DuplicateUtils(pMappingObj)).execute());
    }
    catch (e)
    {
        logging.log(e, logging.ERROR, [
            "error while trying to load duplicates for " + vars.getString("$sys.currentcontextname") + " for user " + vars.get("$sys.user"),
            "Duplicate_entity.jdito.contentProcess()",
            e["rhinoException"] ? e["rhinoException"].toString() : (e.name + ": " + e.message + " " + e.stack)]);
    }
Debugging vs. temporary logging
Besides permanent logging (e.g., to log errors in the catch section, see above), temporary logging is sometimes used in the development process. This raises the question when to use temporary logging and when to use the ADITO Designer's built-in debugger. Generally, the debugger provides you with a lot of options that go beyond pure logging, e.g., you can
- quickly inspect the values of all variables being valid at a specific code line,
- dynamically step from code line to code line, in order to watch the variables' values change
- execute functions
- define conditions when to halt at certain code lines
- manipulate variables by setting certain values
- and many more (see the chapter "Debugger" in the Designer Manual (PDF)).
Therefore, the debugger should be the instrument of your choice in most cases. On the other hand, activating the debugger takes some time and decreases the system's performance - thus, e.g., if you only want to quickly inspect the value of a specific variable, adding a simple temporary logging might be preferred:
logging.log("The value of myVariable at code line 173 is " + myVariable)
Of course, you can also combine this with a condition:
if (myVariable > 100) {
  logging.log("myVariable exceeds 100! Its value is " + myVariable);
}
Nevertheless, a common mistake is to overload your code with temporary log entries and later forgetting to remove them again. At least, you should add an inline comment that marks the logging as temporary:
// TODO remove again
logging.log("My temporary logging text.");
To view the cloud server log in the Designer window Output:
-
Set the system property
loggingTelnetEnabledtotrueundersystem > default > ____CONFIGURATION > Logging > Telnet. -
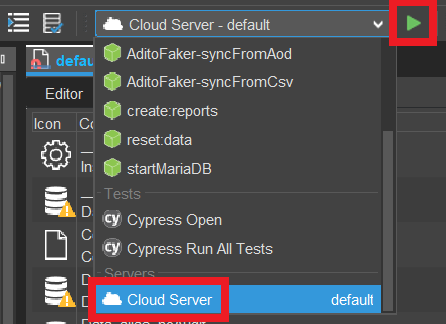
Choose
Cloud Server - <system name>, for exampleCloud Server - default, from the combo box in the middle of the Designer button bar and press the green start button to its right.
After a few seconds, the confirmation Connected to server appears in a sub-window of the Designer window Output, for example Cloud Server: default. All further log entries then appear in that sub-window.
In addition to customized logging, all JDito processes and database access, that is, SQL statements, can be logged if the corresponding log level is activated via the system preferences:
Navigate to system > default > ____CONFIGURATION > Logging > Logging > loggingDebugLevel, select DB or JDITO as required, and save the changes.
After a few seconds, various log entries should appear in the output window while working with the client. Due to a known issue, the logger may connect to the wrong web server pod and therefore show no output. In that case, close and reopen the tunnels until it works. This workaround is expected to be replaced in a future ADITO version.