Deploying with the ADITO Standalone Tools
The ADITO Standalone Tools extension for Visual Studio Code manages the native standalone tools (transpile, deploy, convert) that are needed to deploy an ADITO project, and provides the complete deployment workflow inside VS Code: it checks the database connections of your project, runs a transpile and a deploy dry run, and shows the result in a view where you select the files to deploy.
The extension is included in the ADITO Extension Pack and can also be installed separately from the Visual Studio Code Marketplace.
The ADITO Standalone Tools extension is in preview and under active development. Expect breaking changes between versions. Report errors and unexpected behavior by creating a ticket.
Requirements
Before you start, verify the following prerequisites:
- Visual Studio Code is installed, see Setting up VS Code.
- Node.js and npm are installed, see Install Node.js and npm.
- Your workspace contains an ADITO project (a
.aditoprjfolder). The extension only activates in workspaces that contain an ADITO project. - On Windows, the
aditoStandaloneTools.npmLocationsetting points to yournpm.cmd, otherwise the transpile does not run, see Settings. - Database connections are configured as
*.liquibase.propertiesfiles, see DB connections.
macOS is currently not supported, because no suitable tool variant is provided yet. The extension supports Windows and Linux. Only the first folder of a multi-root workspace is used.
Example: deploying a project for the first time
You are new to the project and want to deploy it? This example walks you through a complete deployment from scratch. Each step links to the detailed description.
Before you start: Your workspace contains the ADITO project, and you know which system (database) you want to deploy to.
- Open the project and let the tools download. When you open the workspace, the extension activates and downloads the standalone tools automatically. Watch the ADITO Standalone Tools output channel until the tools are downloaded, see Downloading and updating the standalone tools.
- Provide a database connection. If the connection file for your target system does not exist
yet, create it with the Liquibase extension or generate it from the server configuration with a
devtools script, see Creating connections. The database must contain the
ASYS_SYSTEMtable, otherwise the connection is not available for the deploy. - Open the Deployment Overview. The view shows one group per database connection with its availability, see The Deployment Overview view. If a connection is shown as not available although it should work, revalidate the connections with the refresh button in the view title.
- Start the deployment. Select Start Deployment in the status bar or run the command from the Command Palette, see Starting a deployment.
- Select the system and the options. Pick your target system from the available connections and choose the additional options, see Selecting the system and options. If the system is not available, a confirmation dialog asks whether to deploy anyway.
- Wait for the preparation. The project is fully transpiled, converted, and the deployable files are collected with a dry run, see Collecting the deployable files.
- Select the files to deploy. The Deployment Overview view now lists every deployable file with a checkbox. Check the files you want to deploy, see Deploying the selected files.
- Deploy. Select the Deploy selected files button of your connection group. When the deploy finished successfully, a success message is shown and you can verify the result in the database, see Verifying Deployment Results.
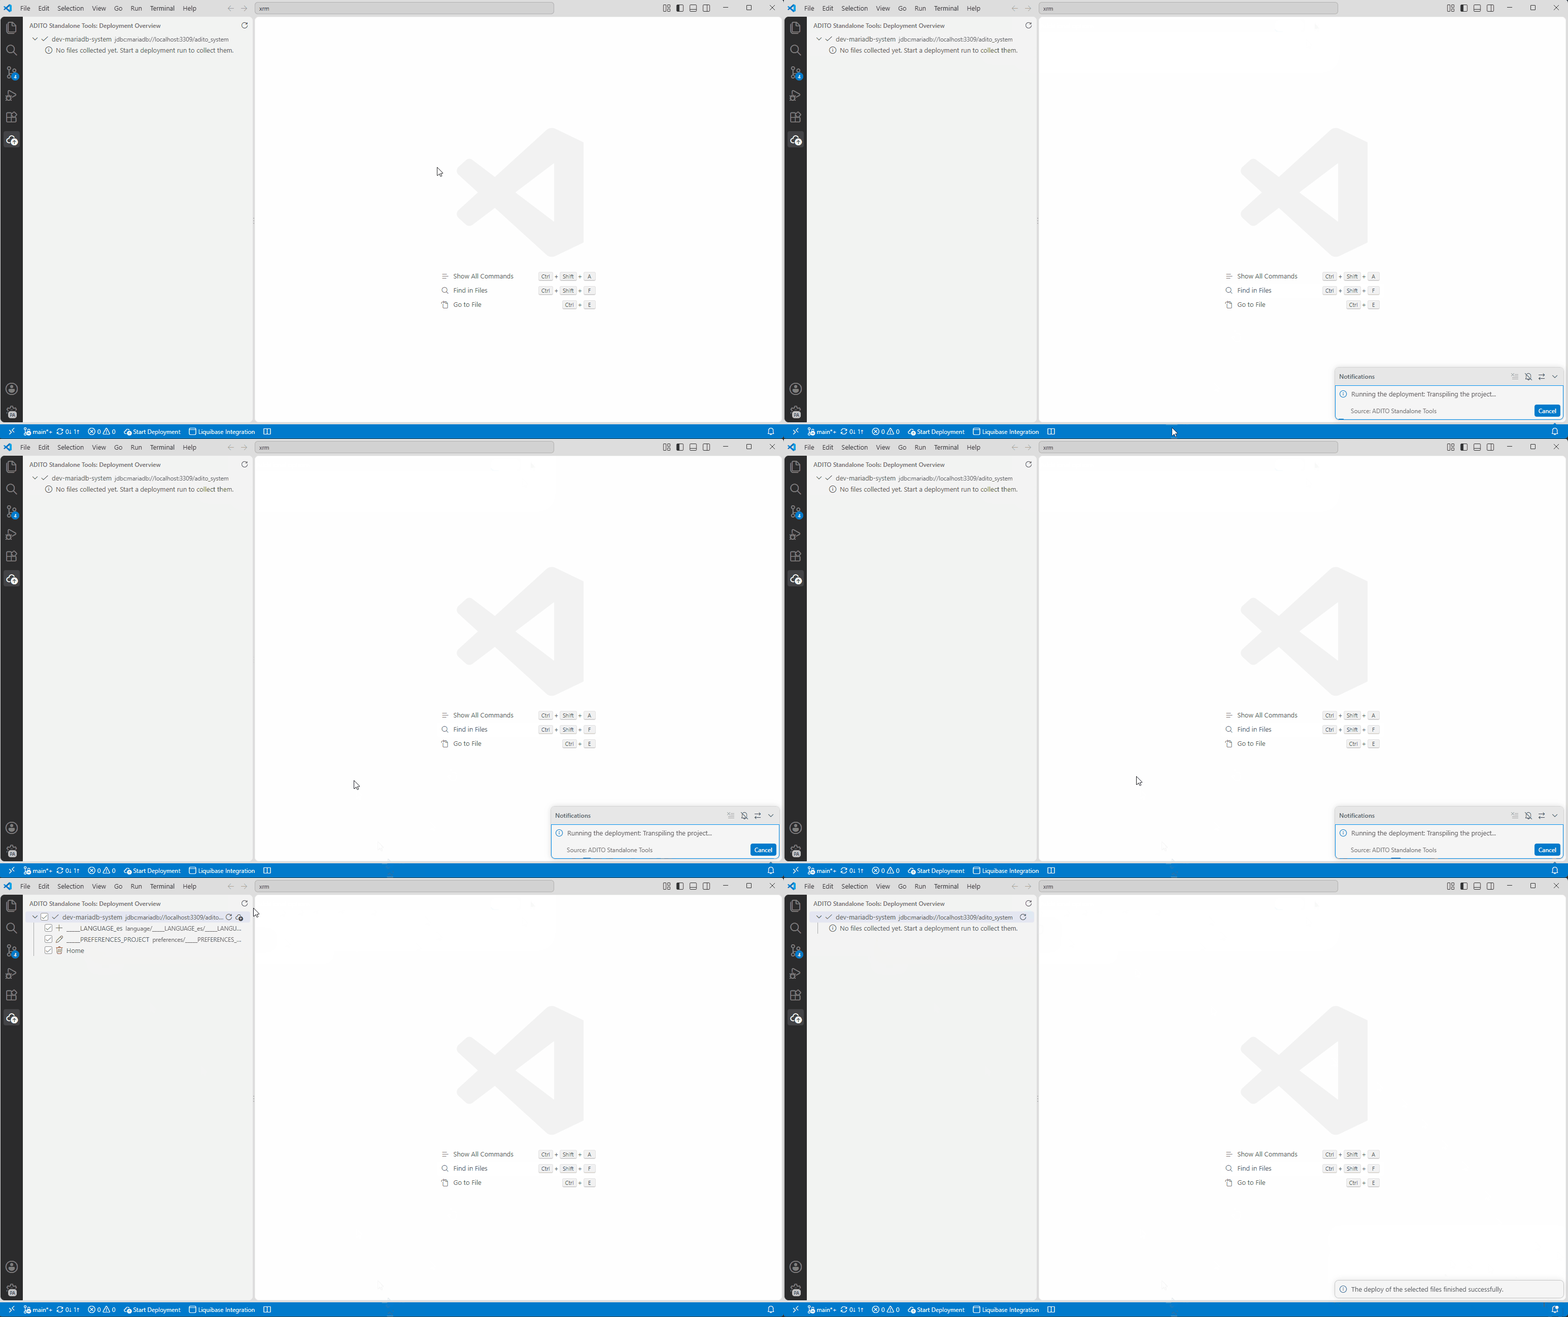
Figure: The complete example workflow: from the empty view to the successful deploy.
Downloading and updating the standalone tools
You do not download the standalone tools yourself. As soon as the extension activates in a workspace
that contains a .aditoprj folder, it downloads the configured tools from the ADITO tools webservice
and stores them in the global storage of VS Code. From then on, it keeps the tools up-to-date
automatically:
- The tools are checked and downloaded on every activation of the extension.
- A tool is only downloaded again when the version offered by the webservice really differs from the stored one (compared by checksum), so unchanged tools are not transferred needlessly.
- When you change the
aditoStandaloneTools.toolssetting, the tools are downloaded again right away, without running anything manually. Changes to the other settings do not trigger a download. - A download is written to a temporary location first and only replaces the old tool after it finished successfully, so an interrupted download never leaves a corrupt tool behind.
- If a single tool cannot be downloaded (for example, because the webservice has no information about it), the remaining downloads continue, and a notification tells you which tools failed.
The following tools exist:
| Tool | Purpose |
|---|---|
transpile | Transpiles the project (required for the deployment). |
deploy | Runs the deploy, including the dry run (required). |
convert | Converts the transpiled output before the deploy (optional). |
By default, only transpile and deploy are downloaded. To also download the convert tool, add it
to the aditoStandaloneTools.tools setting, see
Settings.
Commands for tool management
Both commands are available in the Command Palette (Ctrl+Shift+P) under the category ADITO Standalone Tools:
| Command | Description |
|---|---|
| Download all standalone tools | Downloads all configured tools and keeps them up-to-date, for example after a webservice outage. |
| Show standalone tool information | Shows an overview of the stored tools, their versions, and their storage location in the output channel. |
Where the tools are stored and logged
Every download, update, and error is written to the ADITO Standalone Tools output channel. Open it via View > Output (Ctrl+Shift+U) and select ADITO Standalone Tools from the dropdown on the right side of the Output panel: the panel opens with the channel that was used last, so you usually have to switch the channel first. The output shows which tools were downloaded, which version each tool has, and why a tool was not downloaded.
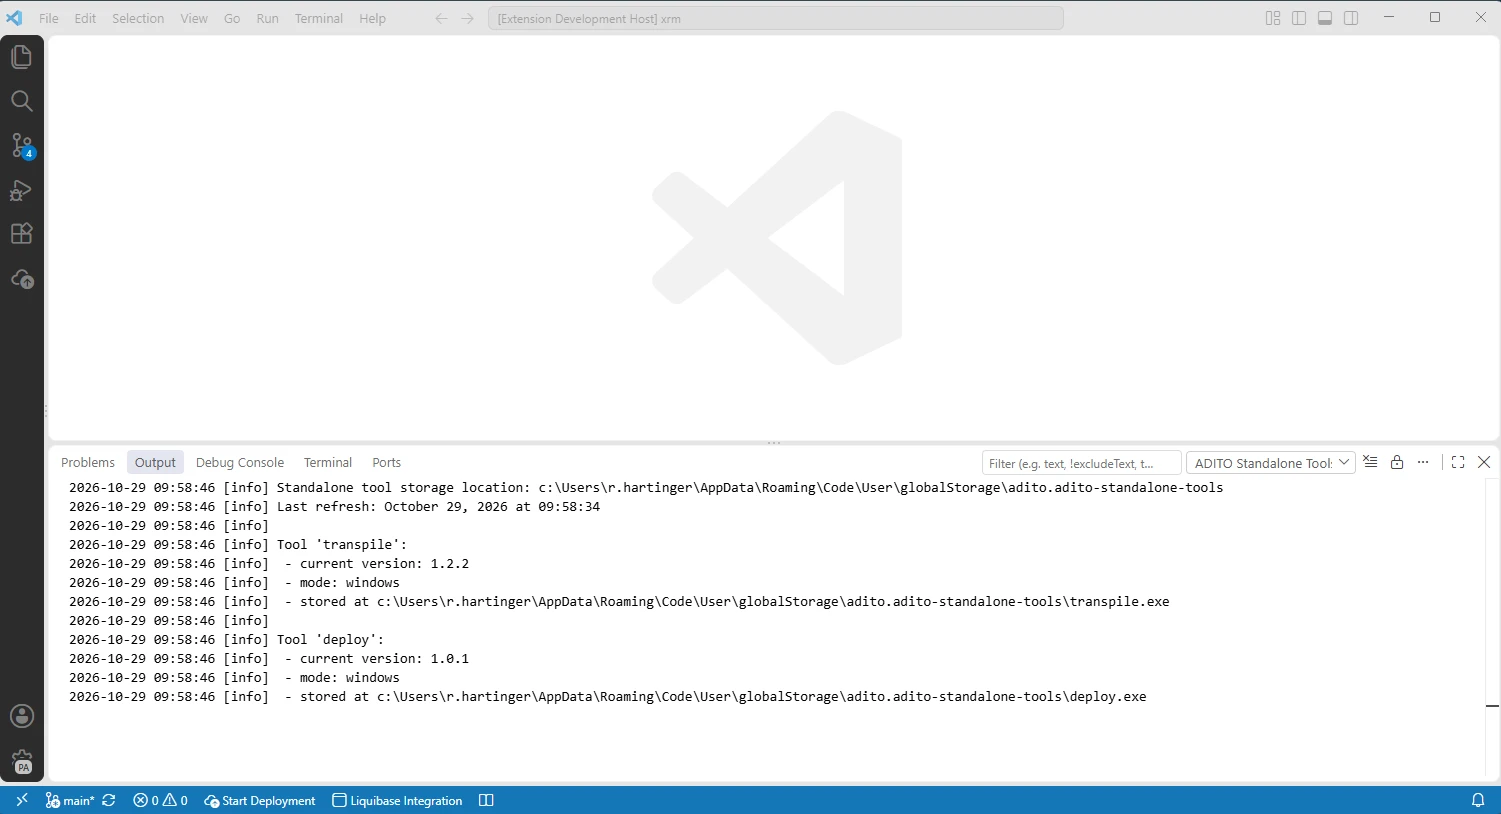
Figure: The output channel shows the storage location, the last refresh, and the version of each tool.
The downloaded tools are stored in the global storage of VS Code, under
adito.adito-standalone-tools:
| Platform | Path |
|---|---|
| Windows | %APPDATA%\Code\User\globalStorage\adito.adito-standalone-tools |
| Linux | ~/.config/Code/User/globalStorage/adito.adito-standalone-tools |
| macOS | ~/Library/Application Support/Code/User/globalStorage/adito.adito-standalone-tools |
macOS is currently not supported, because no suitable tool variant is provided yet. The path is only listed for completeness, no tools are stored there.
Run Show standalone tool information to see the exact location on your machine and the version of each tool at a glance.
Settings
The extension contributes its own settings under the identifier aditoStandaloneTools. You can
reach them in two ways:
- Open the settings editor (File > Preferences > Settings, Ctrl+,) and search for ADITO Standalone Tools.
- On the extension page in the Extensions view, open the gear icon and select Extension Settings.
Each setting is described directly in the settings editor, so the descriptions are always up to date with the installed version.
On Windows, set aditoStandaloneTools.npmLocation to the full path of your npm.cmd (for example
C:/Program Files/nodejs/npm.cmd). Without this setting, the transpile does not run.
Set the aditoStandaloneTools.compatibilityMode setting (c11y modes) with caution: it switches the
transpile to legacy behavior and should only be used when your project explicitly requires it.
The extension also uses the liquibase.configurationPath setting of the Liquibase 4
Integration extension to locate the database connections of your project, see
DB connections.
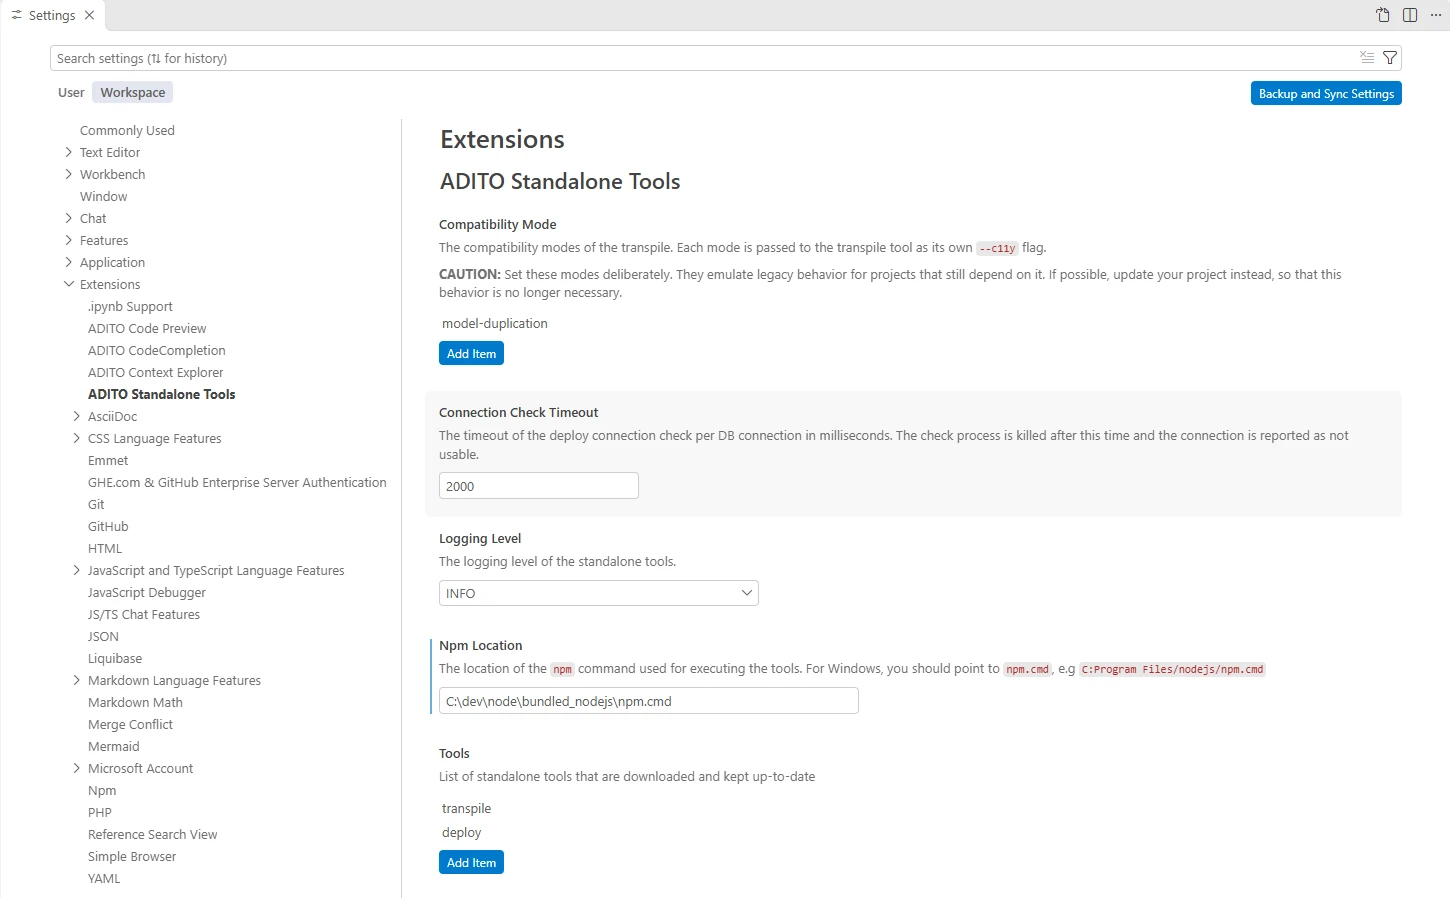
Figure: The settings of the extension in the settings editor.
Tasks
The extension provides its tools through the VS Code task system, so no per-project task files are needed. The tasks are available in the task picker under the type ADITO Standalone Tools:
- Open the Command Palette (Ctrl+Shift+P).
- Run Tasks: Run Task.
- Select the group ADITO Standalone Tools.
- Select one of the tasks.

Figure: The task picker groups the tasks of the extension under the type adito-standalone-tools.

Figure: The four tasks of the extension in the task picker.
The extension provides the following tasks:
ADITO: Collect Deployable Files (Dry Run)
Collects the deployable files with a dry run. The task asks for the same inputs as the start deployment command (system and options).
The task uses the transpile output of a previous run and does not convert the project first, so its result can be outdated. Its output is very technical and not meant for everyday use: for the deployment, use the deployment workflow instead, see The deployment workflow.
ADITO: Transpile (Full)
Runs a full transpile of the project into its dist folder.
ADITO: Convert (AOD) and ADITO: Convert (YAML)
Converts the project into the AOD output format or into the schema-guided YAML output format.
Both convert tasks write their result into a default folder next to your project folder: the project
folder name with the suffix -aod (AOD output) or -yaml (YAML output). For example, converting
my-project writes the YAML output into the sibling folder my-project-yaml.
Adding tasks yourself
You can add the tasks to a tasks.json of your project, for example to run them as part of a build.
Each task uses the type adito-standalone-tools, and the task property selects the concrete task:
task value | Task |
|---|---|
deploy-dry-run | ADITO: Collect Deployable Files (Dry Run) |
transpile-full | ADITO: Transpile (Full) |
convert-aod | ADITO: Convert (AOD) |
convert-yaml | ADITO: Convert (YAML) |
{
  "version": "2.0.0",
  "tasks": [
    {
      "label": "Full transpile",
      "type": "adito-standalone-tools",
      "task": "transpile-full"
    }
  ]
}
For general information about defining tasks in a tasks.json, see the official VS Code
documentation about tasks.
DB connections
The deploy targets of the extension are the database connections of your project. They are read from
*.liquibase.properties files in the folder configured by the liquibase.configurationPath setting
of the Liquibase 4 Integration extension (default: data/liquibase inside your project).
Each file describes one connection:
- The alias of the connection is derived from the file name. A file named
SYSTEMALIAS.liquibase.propertiesprovides the connection with the aliasSYSTEMALIAS. - The file must contain the properties
url,username, andpassword. The optionaldriverproperty selects the database driver.
Liquibase configuration files contain database credentials. Do not commit these files or the
configuration folder to version control. Add them to .gitignore instead.
Creating connections
How you create the connection files depends on your project:
-
With the Liquibase 4 Integration extension: the extension provides commands to create, add, and edit Liquibase configurations in Visual Studio Code. See Create a Liquibase configuration on the Liquibase extension page.
-
With the JS DevTools scripts: the scripts generate the connection files from your existing ADITO server configuration files (
serverconfig.xml). Each script is described on its own page:
A connection is only usable for the deploy when its database contains the ASYS_SYSTEM table. This
table normally exists only in the system alias database. Connections to data alias databases
(for example generated by the DATA_ALIAS script) do not contain this table and are therefore always
reported as not available for the deploy, even when the database is reachable. When you generate
the connection files from your server configuration, only the SYSTEMALIAS connection is relevant for
the deploy.
Automatic availability check
The extension validates every connection file it finds:
- The check runs when the extension activates and whenever a connection file in the configuration folder is created, changed, or deleted.
- Each connection is checked with a canary dry run against the database. A connection that cannot be
reached within the configured timeout (
aditoStandaloneTools.connectionCheckTimeout) is reported as not usable. - A connection is only usable for the deploy when its database contains the
ASYS_SYSTEMtable. A connection without this table is reported as not available for the deploy, even when the database itself is reachable. - While the check of a newly discovered connection is still running, it is already shown in the view with a loading indicator.
In the connection picker of the deployment dialog, the available connections are grouped under Available, and the failed ones under Not available.
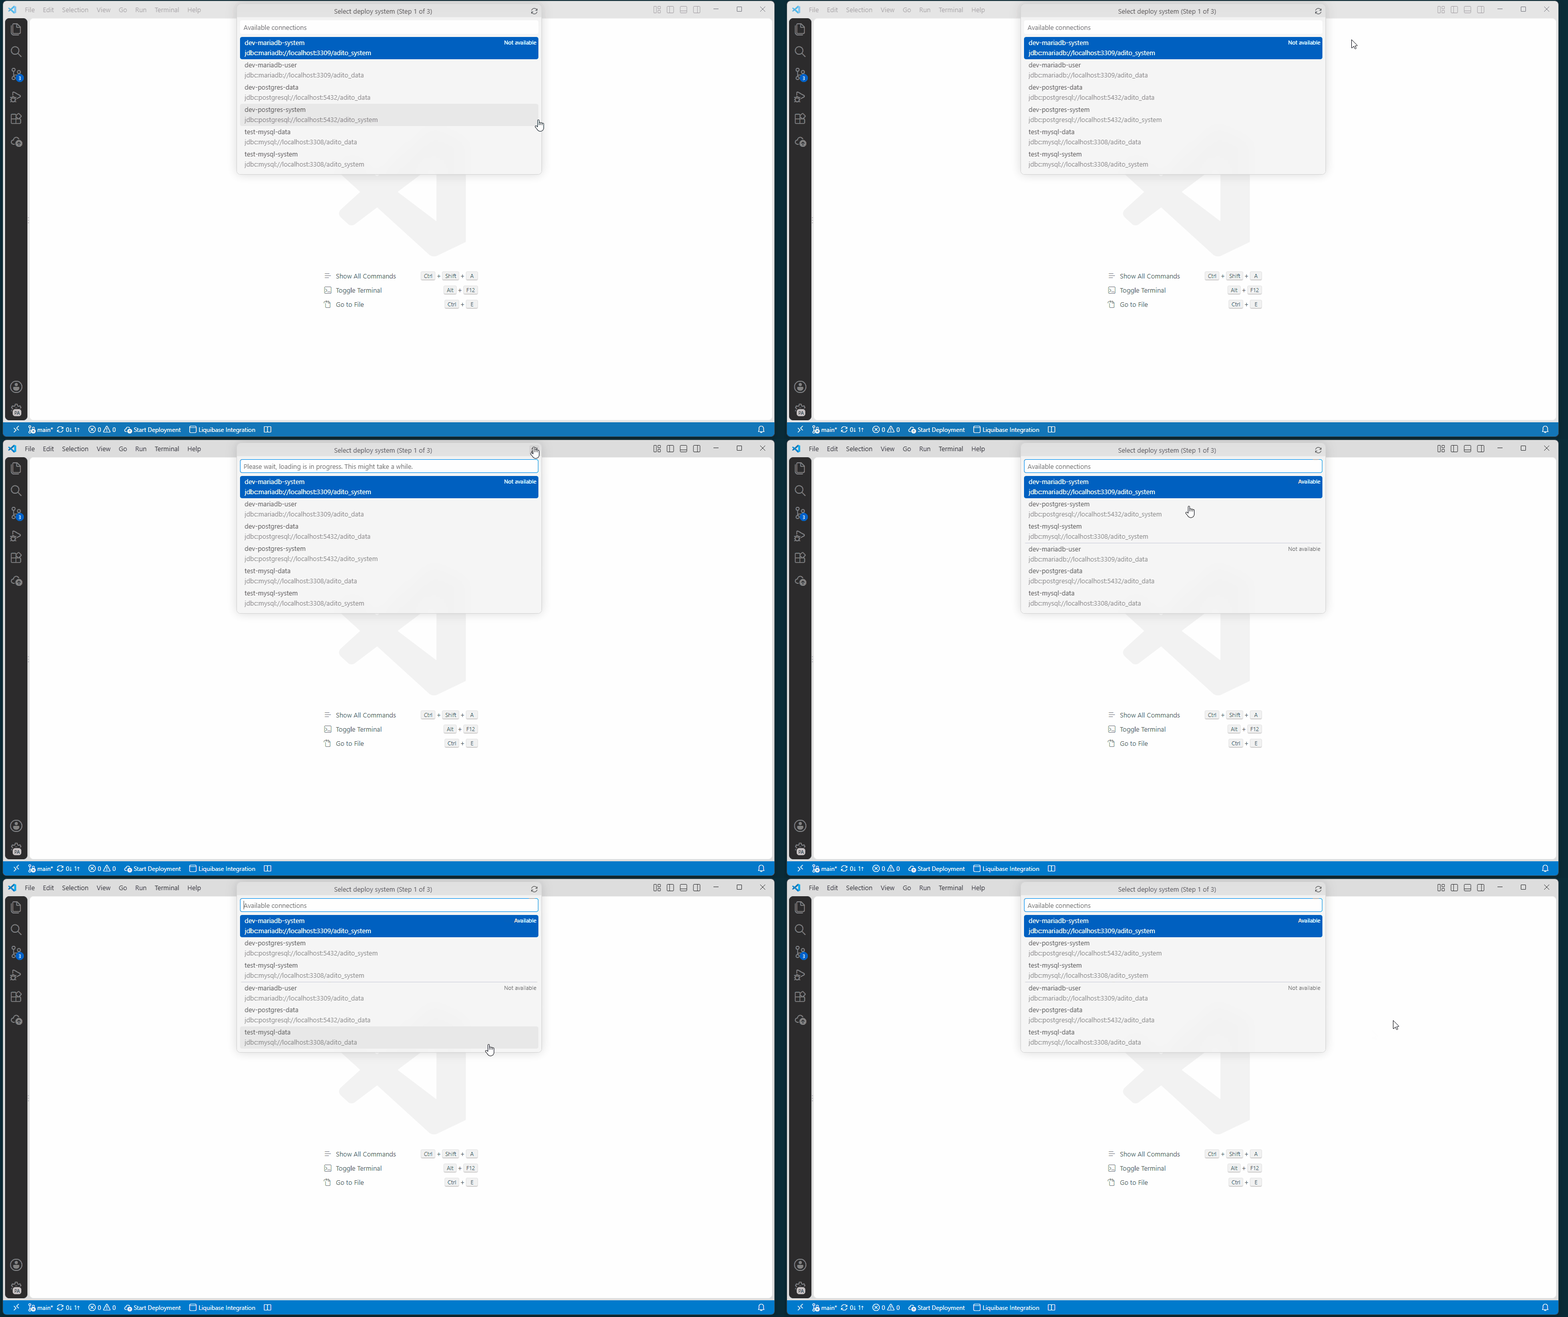
Figure: The connections are revalidated, for example with the reload button of the dialog, and then grouped into Available and Not available.
Use a Designer tunnel for deployment
The extension can use a database tunnel opened in the ADITO Designer. Enable
aditoStandaloneTools.resolveJDBCHostnameToIP in the VS Code Settings editor;
the setting is enabled by default. Open Preferences: Open Settings (UI)
from the Command Palette and search for the setting name to check its value.
- Open the database tunnel for the SSP system in the Designer and keep it open. See Use Designer tunnels.
- Configure the system's
*.liquibase.propertiesconnection in VS Code, if you have not already done so. - In the Deployment Overview, select Revalidate DB connections. Once the connection is available, start the deployment as described in The deployment workflow.
The extension resolves the JDBC hostname before a connection check, dry run, or deploy. It first uses the system resolver. If the hostname is not resolved there, it checks the hosts files maintained by installed Designer versions. The original JDBC URL in the connection file and the VS Code views remains unchanged. The extension does not open the tunnel or change the system hosts file. If the setting is disabled, the extension does not perform this hostname resolution; an unresolved connection may remain unavailable.
When the system resolver cannot resolve a hostname, the extension searches the following Designer user directories for tunnel mappings:
| Operating system | Designer hosts file |
|---|---|
| Windows | %APPDATA%\.aditodesigner\<version>\config\hosts |
| Linux | ~/.aditodesigner/<version>/config/hosts |
| macOS | ~/Library/Application Support/aditodesigner/<version>/config/hosts |
If multiple Designer versions are installed, the extension checks the hosts files in order of their modification time, newest first. Custom Designer user directory locations are not included in this search.
An outdated system hosts entry can take precedence over the Designer mapping.
If a connection is unavailable despite an open tunnel, check for stale system
hosts entries, verify that the correct Designer tunnel is open, and revalidate
the connection. On Windows, the system hosts file is at
C:\Windows\System32\drivers\etc\hosts.
The Deployment Overview view
The Deployment Overview view is the central place for the deployment. It is located in the ADITO Standalone Tools container in the activity bar.
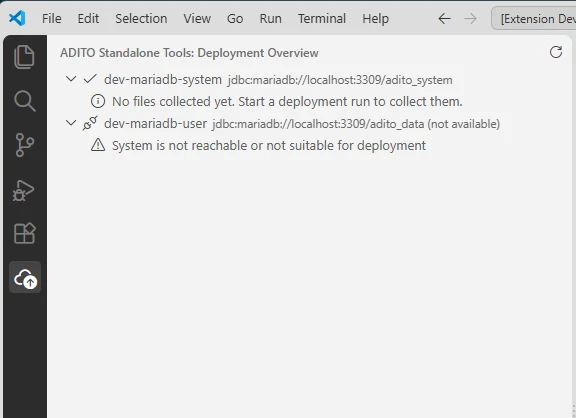
Figure: The Deployment Overview view shows one group per database connection of the project.
The view shows one group per database connection of your project (grouped by JDBC URL). Each group contains one entry per data model that the deploy dry run collected, with:
- the change type the deploy would perform:
insert,update, ordelete, - the name of the data model,
- a checkbox to include the entry in the deploy,
- the file path of the entry for insert and update changes.
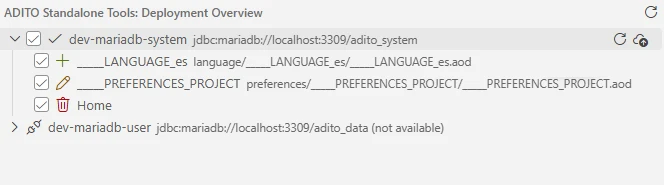
Figure: The collected deployable files of a connection with their change types and checkboxes.
When you hover over a group or entry, the action buttons appear on its right side, see Possible actions.
The view is filled by the deployment workflow, see The deployment workflow. Until you run a deployment, the groups only show the state of their connection. A group (or connection) shows one of the following states:
- A connection that was never part of a deployment run shows No files collected yet. Start a deployment run to collect them.
- A group whose dry run reported no changes shows No data to deploy. System is up-to-date.
- A connection whose DB connection check failed shows System is not reachable or not suitable for deployment.
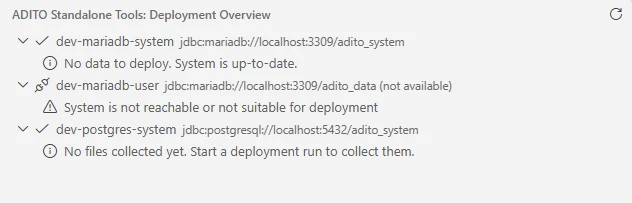
Figure: The possible states of a connection in the view: no changes, not available, and no files collected yet.
Possible actions
The actions of a group (or connection) are available in two ways: as inline buttons when you hover over the entry, and as entries of the context menu when you right-click it.
Collect deployable files (refresh icon): starts or reruns the collection of the deployable files of the connection with a dry run, see Starting a deployment. When files were already collected, only the additional options are asked again, so you can quickly refresh the collected files, for example after you changed files.

Figure: Hovering a connection shows the Collect deployable files again button on its right side.

Figure: For a connection without collected files, the context menu offers Collect deployable files.
Deploy selected files (cloud-upload icon): deploys the checked entries of the group, see Deploying the selected files.
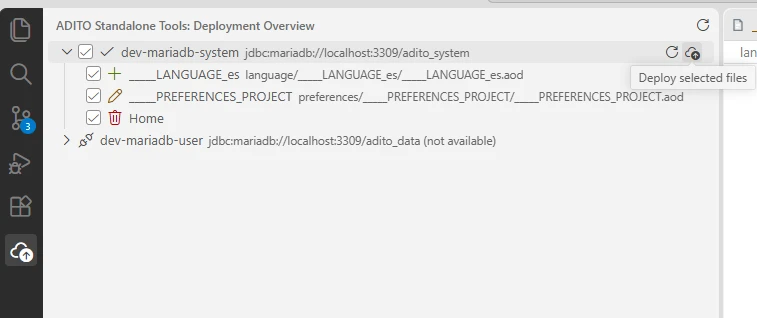
Figure: Hovering a connection with collected files shows the Deploy selected files and Collect deployable files again buttons.
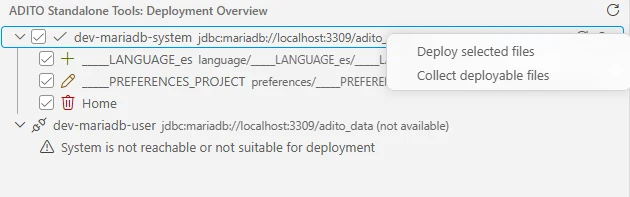
Figure: The context menu offers Deploy selected files and Collect deployable files.
Refreshing connections in the view
Select the Revalidate DB connections button (refresh icon) in the title bar of the view to revalidate all connections manually, for example:
- after you opened a tunnel to a system,
- after the database of a system was restarted,
- when a connection is shown as not available although it should work.
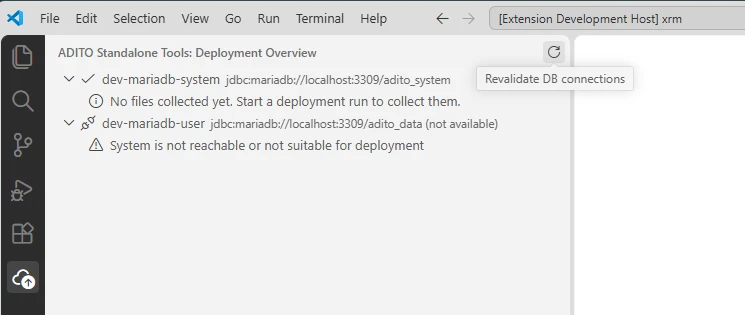
Figure: The Revalidate DB connections button in the title bar of the Deployment Overview view.
The deployment workflow
Starting a deployment
You can start the deployment workflow in three ways:
- In the Deployment Overview view: hover or right-click a connection and select Collect deployable files. The connection is already known, so only the additional options are asked.
- Command Palette (Ctrl+Shift+P): run ADITO Standalone Tools: Start Deployment.
- Status bar: select the Start Deployment button (cloud-upload icon) on the left side of the status bar.
All entry points run the same flow: the inputs are asked, the project is prepared, and the collected deployable files are shown in the Deployment Overview view.
Selecting the system and options
The deploy dialog asks for the deploy targets in multiple steps:
-
Available connections: select the system to deploy to. The list shows every connection of your project, grouped into Available and Not available. The detail line of each entry shows the database URL. While the list loads, all connections are revalidated, so a newly opened tunnel is respected. The reload button on the top right of the list revalidates all connections again, for example after you opened a tunnel while the dialog was already open.
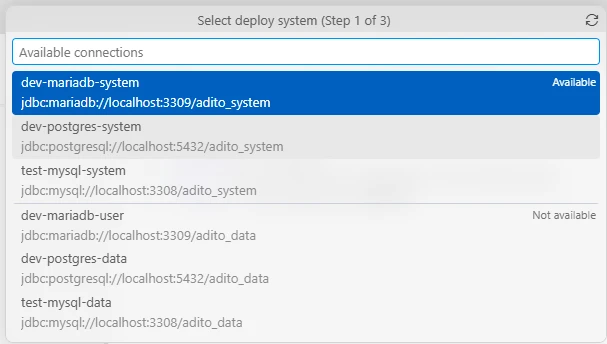
Figure: Step 1 of the deploy dialog selects the system to deploy to. -
Additional options: select one or both options:
- Force deploy deploys unchanged files again as well.
- Deploy user help deploys the user help as well.

Figure: Step 2 of the deploy dialog selects the additional options. -
Confirmation for unavailable systems: if the database connection check of the selected system failed, a confirmation dialog asks whether you really want to deploy to it anyway.
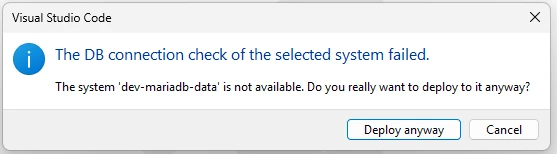
Figure: The deploy to an unavailable system must be confirmed explicitly.
Collecting the deployable files
After the inputs are confirmed, the deployment runs inside a cancellable progress indicator: while collapsed, the progress is shown in the status bar, and it can be expanded to a notification with the current step and a cancel button.

Figure: While the deployment runs, the collapsed progress notification is shown in the status bar.

Figure: Selecting the progress expands it: it shows the current step and a cancel button.
The following steps run in sequence:
- Full transpile of the project.
- Convert of the transpiled output, if the convert tool is downloaded. Without the convert tool, this step is skipped.
- Deploy dry run against the prepared output. In the progress, this step is reported as Collecting the deployable files....
You can cancel the run with the cancel button of the expanded progress; the running transpile or deploy process is then killed. If the preparation or the dry run fails, the error is reported and the previous result in the view is cleared, so no stale file list can be deployed.
The editor is not locked while the deployment preparation runs. Do not edit project files after you started the run: the transpile, convert, and dry run work against the project state at the start, and files edited in the meantime can be invalidated or left out of the deployment.
When the dry run finishes, the collected deployable files appear below the group in the Deployment Overview view, see The Deployment Overview view.
Deploying the selected files
The deploy of the selected files works as follows:
- Run the deployment workflow as described above. The collected deployable files appear in the Deployment Overview view.
- Check every entry that you want to deploy. Entries that you leave unchecked are not deployed.
- Select the Deploy selected files button of the connection group.
The deploy runs with the connection and the options (force, user help) that were remembered from the dry run dialog of that group. A group without checked entries only shows a warning. During the deploy, a progress notification shows the current state and lets you cancel the run.
After a successful deploy, the entries of the group are reset, so the connection stays visible in the view. A failed deploy is reported with the exit code of the deploy tool, and the entries stay unchecked so you can retry.

Figure: The notification after a successful deploy of the selected files.
Current limitations
The following limitations apply to the current version of the extension:
- The deployment always runs a full transpile (and, when the convert tool is downloaded, a convert) before the dry run. There is no way to deploy without this preparation.
- The deployment always starts with a dry run. A direct deploy without a prior dry run is not possible.
- The convert tool is not downloaded by default. Without it, the convert step of the deployment
preparation is skipped. Add
converttoaditoStandaloneTools.toolsto download it. - Deploying individual files is only possible through the checkboxes of the dry run result. A file selection based on git changes is not supported yet.
- A standalone diff of the project against the database (without deploying) is not yet available. A ticket exists for this.
- Only the first workspace folder is used. Multi-root workspaces with several ADITO projects are not supported.
- There is no partial transpile task. The partial transpile runs automatically on file saves via the transpile daemon.
- macOS is currently not supported, because no suitable tool variant is provided yet.
See Known Issues / Limitations for issues and limitations of the parallel operation in general, for example database connection errors and driver warnings during the deploy.
Troubleshooting
A tool is not downloaded
- Open the ADITO Standalone Tools output channel (View > Output) and check the error message, for example an unreachable webservice.
- Run ADITO Standalone Tools: Download all standalone tools once the problem is fixed.
- Run ADITO Standalone Tools: Show standalone tool information to verify the stored tools and their versions.
Generated dist folder
The transpile writes its complete output into the dist folder of your project. Because this folder
is purely generated, the extension contributes default settings when it is installed, so VS Code
does not watch and index every generated file:
files.watcherExcludeandsearch.excludecontain**/dist/**and**/distby default.
Without these defaults, a full transpile can flood the file watcher and the search index of VS Code
to a degree where the extension host stops reacting. Your own settings still win: you can re-include
the folder for a single workspace with "**/dist/**": false. The defaults take effect after
reloading the window.
A transpile task seems to hang
If a transpile task stays at its last output line similar to
[INFO ] Rendering eligible files into ...\dist..., the transpile itself is in most cases already
finished: check the dist folder of your project (the file dates no longer change). What hangs is
the reporting of the task, not the transpile. The cause is the flood of file events that the freshly
written dist folder triggers in VS Code. The extension excludes dist from the file watcher and
the search by default (see Generated dist folder). If you still run into
it:
- Verify that the
distfolder is really complete, so the transpile result is usable. - Check your settings for overrides of
files.watcherExcludeorsearch.excludethat re-includedist(for example"**/dist/**": false) and remove them. - Restart VS Code so that the defaults take effect.
The transpile reports errors for third-party schemas
If the transpile output contains multiple errors like Failed to parse schema https://developers.openai.com/codex/config-schema.json: ..., the yaml.schemaStore.url setting
still contains the default SchemaStore catalog instead of the ADITO schema catalog, see
Transpile reports errors for third-party schemas.
A connection is shown as not available
- Verify that the
*.liquibase.propertiesfile containsurl,username, andpassword. - Verify that the database contains the
ASYS_SYSTEMtable. A connection without this table is not available for the deploy, even when the database itself is reachable. - Verify that the database is reachable, for example via an SQL tool such as SQLTools.
- If a tunnel to the system is required, open the tunnel first and revalidate the connections with the Revalidate DB connections button in the view, see Refreshing connections in the view.
- If the availability check fails although the tunnel is open and the database is reachable from
other tools, the check runs into its timeout: increase the
aditoStandaloneTools.connectionCheckTimeoutsetting, see Settings.